
If your professor just said “run this in SPSS” and you nodded along while internally panicking, I’ve been exactly where you are. You open the program for the first time, you’re staring at what looks like an Excel sheet with two weird tabs at the bottom, there’s no explanation anywhere, and somehow you’re expected to just know what to do. SPSS shows up in psychology, sociology, business, nursing, education, public health, basically half the majors on campus, and professors almost never actually teach you how to use it. They just assume you’ll figure it out. Most of us don’t, at least not right away, and that’s exactly why I put this together.
This isn’t a textbook explanation or some generic tutorial written by someone who’s never had a Sunday night SPSS meltdown before a Monday deadline. This is what SPSS actually does, how to move around the interface without spiraling, which tests you’ll genuinely run in real assignments, the mistakes that get almost everyone at some point, and where to actually go when you’re stuck and it’s midnight and the deadline isn’t moving.
What SPSS Is Actually Used For
SPSS stands for Statistical Package for the Social Sciences, though at this point it’s used way outside just social sciences. Basically, it’s software that lets you organize data and run statistical tests on it without writing any code, which is exactly why so many intro and intermediate stats courses build entire assignments around it instead of Excel or R.
You’ll run into it most in research methods classes, thesis or dissertation chapters, and any course where you’re handed a dataset or survey results and told to “analyze” it. If your assignment is about testing whether two groups are actually different, or whether two things are related, there’s a good chance your professor wants that done in SPSS specifically, because it handles more advanced tests without you needing to build formulas from scratch like you would in Excel.
One thing that would’ve saved me some confusion early on: SPSS isn’t really meant for messy data cleanup or anything code-heavy. It’s built to take a dataset that’s already reasonably organized and run established statistical tests on it, spitting out readable output tables. That’s it. That’s genuinely most of what undergrad and grad coursework needs it for, so once you stop expecting it to do everything, it gets a lot less intimidating.
Key Features Overview
Before you go clicking through every menu hoping something looks familiar, it helps to actually know what’s in there. Here’s the rundown of what you’ll actually touch during a normal semester.
| Feature | What It Does | When You’d Use It |
| Data View | Spreadsheet-style grid where your actual data lives, one row per case | Entering or reviewing your raw data |
| Variable View | Defines each variable, its type, labels, and measurement level | Setting your dataset up correctly before you touch analysis |
| Descriptive Statistics | Calculates mean, median, standard deviation, frequencies | Getting a feel for a variable before anything deeper |
| Compare Means and T-Tests | Tests whether group averages differ in a meaningful way | Comparing two groups, like control vs. treatment |
| Correlation and Regression | Measures relationships and predicts outcomes between variables | Testing whether one variable relates to or predicts another |
| Crosstabs and Chi-Square | Looks at relationships between categorical variables | Survey data with yes/no or multiple choice answers |
| Chart Builder | Builds bar charts, histograms, scatterplots, etc. | Making your results presentable for a report or presentation |
| Syntax Editor | Lets you write and save commands instead of clicking through menus every time | Rerunning the same analysis on updated or multiple datasets |
You genuinely do not need to memorize this whole table right now. Most students end up leaning on the same four or five features all semester, so it’s less about knowing everything and more about knowing where to go when your assignment says “run a t-test” and you have no idea where that even lives in the menu.
How SPSS Compares to Other Tools You’ll Hear About
At some point, usually when you’re comparing notes with a friend in a different section or a different major, you’ll realize not everyone is using SPSS. Some professors build their courses around R or RStudio instead, some business and econ programs lean on Stata, and plenty of intro courses still lean on Excel for the basics before anything else gets introduced. It helps to know how these actually stack up instead of just hearing the names thrown around.
- SPSS is menu-driven, so you’re clicking through dialog boxes instead of writing commands, which is exactly why so many intro and intermediate stats courses default to it. It’s the easiest of the bunch to pick up cold, but it’s less flexible if your analysis gets genuinely complex or custom.
- R and RStudio require actual coding, which is a real learning curve if you’ve never programmed before, but they’re free, open-source, and can handle basically any statistical method that exists, including ones SPSS doesn’t support out of the box. You’ll see this a lot more in grad-level stats, data science tracks, and programs that expect some coding literacy going in.
- Stata sits somewhere in between. It uses a command-based syntax like R, but the commands are simpler and more standardized, which is part of why it’s so common in economics, political science, and public health programs, especially for panel data and survey-based research.
- Excel can handle basic descriptive stats and simple charts just fine, but it wasn’t built for hypothesis testing, and things like regression or chi-square require a lot more manual setup, formula-building, or add-ins to get right. It’s a fine starting point, but it’s rarely what your professor actually wants for a real stats assignment.
Here’s the quick side-by-side if you just want a fast comparison instead of reading through all of that.
| Tool | Interface Style | Learning Curve | Cost for Students | Where You’ll See It Most |
| SPSS | Menus and dialog boxes | Low, no coding required | Usually free through campus license | Psychology, sociology, nursing, education, business |
| R / RStudio | Code-based | Steep at first, very flexible once learned | Free and open-source | Data science, grad-level stats, research-heavy programs |
| Stata | Command-based syntax | Moderate, simpler syntax than R | Often free through campus license, otherwise paid | Economics, political science, public health |
| Excel | Spreadsheet and formulas | Low, but limited for real statistics | Usually already included with student Office access | Intro courses, basic descriptive work, quick calculations |
None of these is objectively “better,” they’re just built for different comfort levels and different kinds of analysis. If your program has you using SPSS, that’s usually because your coursework doesn’t need custom coding, and menus are simply faster to teach a whole class at once. If you end up needing R or Stata later, a lot of the underlying logic, like what a t-test or a regression is actually doing, carries over. You’re not starting from zero, you’re just learning a new way to ask the same questions.
Getting Started With SPSS, Practically
Here’s the part most guides conveniently skip: actually getting from a blank screen to something you can turn in.
First, before you consider buying it, check your school’s IT page or library site. Almost every university gives students access through a campus license or a virtual lab, and buying it yourself is expensive and rarely necessary. I know at least one person who paid for it out of pocket before realizing their school had free access the whole time, so don’t be that person.
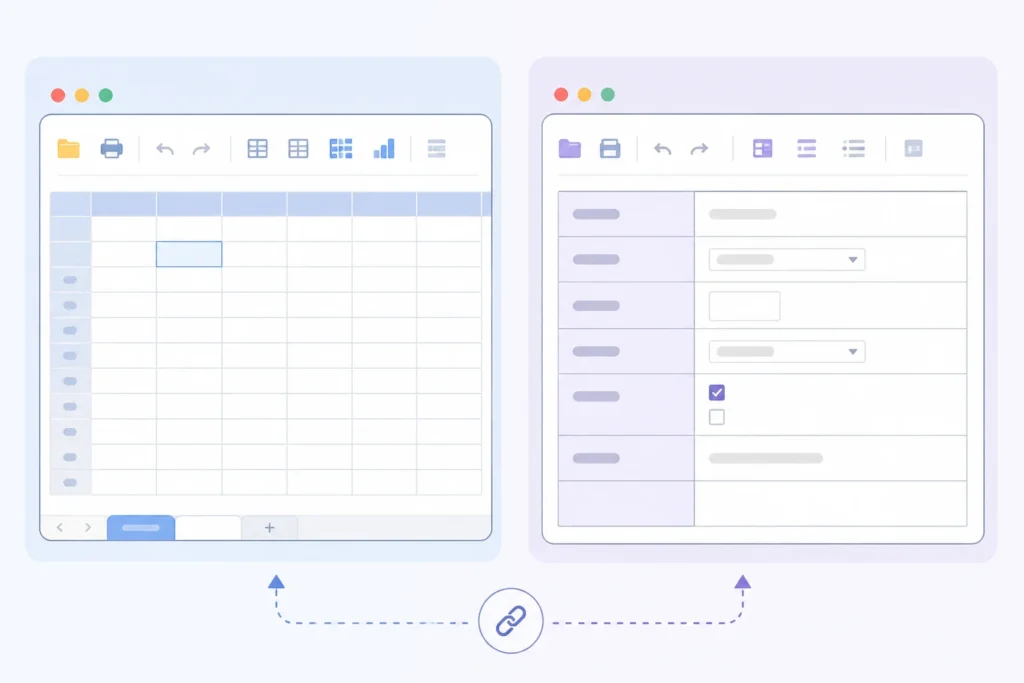
Once it’s open, the first real thing to wrap your head around is the difference between Data View and Variable View, because this trips up an enormous number of students in week one and nobody warns you about it. Data View is where your actual numbers and responses sit, laid out like a normal spreadsheet. Variable View is where you tell SPSS what each column actually means, whether it’s a number, text, or a category, and what measurement level it is, like nominal, ordinal, or scale. Skip this setup step and SPSS will treat everything like plain numbers, which is probably the single biggest reason students get results that look wrong for no obvious reason.
To bring in a dataset, you can open an existing Excel file directly through File, then Open, then Data, and SPSS walks you through matching your columns to variable names. From there, running your actual analysis usually means going to the Analyze menu, picking the category of test your assignment is asking for, like Descriptive Statistics or Compare Means, and selecting your variables in the dialog box that pops up. SPSS then generates a separate output file with your tables and any charts you asked for.
If all of this already feels like a lot on a first read, that’s completely normal, and you’re not missing some obvious thing everyone else already knows. This is genuinely one of those things that clicks way faster with someone walking you through your actual assignment in real time instead of you trying to reverse-engineer a random YouTube video that’s using a totally different dataset than yours. Live tutoring for statistical software tends to save students hours compared to piecing it together alone, especially once your assignment involves more than one type of test stacked on top of each other.
Common Statistical Analyses Students Actually Run in SPSS
A huge chunk of the anxiety around SPSS isn’t the software itself, it’s not knowing which test you’re even supposed to run for a given assignment. So here’s the plain-language version of the ones that show up over and over.
- Descriptive statistics are usually where you start no matter what else the assignment asks for. They summarize a variable with numbers like the mean, median, and standard deviation, basically giving you a first look at your data before anything more complicated happens.
- T-test compares the average of two groups to see if the difference between them is actually meaningful or just random noise. You’ll see this constantly in experimental designs, like comparing scores between a group that got some kind of intervention and a group that didn’t.
- Correlation measures how strongly two variables move together, without claiming one causes the other, which is a distinction professors love to test you on. If your question is something like whether more study hours relate to higher grades, correlation is usually your first move.
- Regression takes correlation a step further by letting you predict one variable based on another, or several others at once. This one shows up constantly in thesis work when you’re trying to explain what factors are actually driving an outcome.
- Chi-square tests are for categorical data, checking whether there’s a relationship between two variables that aren’t numeric, like gender and preferred study method on a survey. If your data is made of categories instead of numbers, chi-square is probably what your professor is expecting, even if the assignment sheet doesn’t spell that out clearly.
Here’s a quick table so you can match your assignment to the right test faster instead of guessing.
| Analysis | Best For | Example Use Case |
| Descriptive Statistics | Summarizing one variable | Average exam score across a class |
| T-Test | Comparing two group averages | Test scores between two teaching methods |
| Correlation | Checking a relationship between two variables | Study hours and GPA |
| Regression | Predicting an outcome from one or more variables | Predicting income from education level and age |
| Chi-Square | Relationships between categorical variables | Survey responses across different age groups |
Mistakes That Get Almost Every Student at Some Point
A handful of mistakes come up again and again, and honestly, most of them are avoidable once someone actually tells you to watch for them, which is usually the missing step.
- Skipping Variable View setup, which leads SPSS to treat numeric codes as plain numbers instead of categories, quietly throwing off your results without any error message telling you something’s wrong.
- Running the wrong test for the data type, like using a t-test on categorical data when what you actually needed was a chi-square test.
- Ignoring missing data, which can quietly skew your results if SPSS is including blank or placeholder values in a calculation without you realizing it’s happening.
- Misreading the output, especially confusing statistical significance with how large or meaningful an effect actually is in practical terms, which is an easy trap on exams and write-ups alike.
- Not saving your syntax, meaning you have to redo every single click by hand if you need to rerun the same analysis later on updated data, which happens more often than you’d think, especially with thesis data that keeps changing.
Catching these usually comes down to slowing down at the setup stage instead of rushing straight to the Analyze menu, because a shaky foundation causes way more confusion down the line than the actual statistics ever do.
Where to Get Help When You’re Actually Stuck
At some point, almost every student hits a wall with SPSS that no textbook or random forum thread can fully untangle, usually because your specific dataset or assignment doesn’t line up with the generic example everyone online is using. That’s normal, and it’s worth having an actual plan for it instead of just staring at an error message for an hour wondering what you did wrong.

This is where Skyline Academic has genuinely stood out to me. It offers 1:1 personalized live tutoring, meaning you work through your actual dataset and your actual assignment with someone in real time, instead of trying to reverse-engineer a tutorial that doesn’t quite match what’s in front of you. If your coursework also involves systems modeling, Skyline Academic offers reliable 1:1 personalized live tutoring support for Vensim PLE as well, which is genuinely hard to find help for anywhere else.
It also offers something that quietly matters more than most students expect going in. Skyline Academic offers free AI detection for students, so before you submit a stats write-up or report, you can check where it stands instead of finding out after the fact, which is a real bit of peace of mind when you’re juggling more than one deadline at once.
And if your program has you bouncing between multiple types of software instead of just SPSS, it’s worth knowing that Witness simulation software comes up a lot in operations and industrial engineering coursework, and it’s another area where getting the right support upfront saves a lot of frustration later, instead of trying to piece it together the night before it’s due.
FAQs About SPSS for Students
Is SPSS hard to learn for beginners?
It looks intimidating at first because of the two view tabs and the heavy menu system, but most students genuinely get comfortable with the basics within a few sessions of actually using it on real data instead of just reading about it.
Do I need to know how to code to use SPSS?
No. SPSS is built around menus and dialog boxes rather than code, though it does have an optional syntax editor for students who want to save and reuse commands later on.
What’s the difference between SPSS and Excel for statistics?
Excel is fine for basic calculations and simple charts, but SPSS is built specifically for statistical testing, so it handles things like regression, ANOVA, and chi-square with a lot less manual setup on your end.
Can I use SPSS for free as a student?
Many universities provide free or discounted student access through a campus license or virtual lab, so it’s worth checking with your school before you consider buying it independently.
What statistical test should I use for my SPSS assignment?
It depends on your data type and your actual question, but as a rule of thumb, comparing two numeric groups usually means a t-test, checking a relationship between numbers usually means correlation or regression, and categorical data usually means chi-square.
Why does my SPSS output look so confusing?
SPSS output tables throw a lot of information at you all at once, and the real skill is learning which specific numbers, like the significance value, actually answer your research question instead of trying to read every single cell like it matters equally.
Is SPSS still used in 2026?
Yes, it’s still widely used across social sciences, business, nursing, and education programs, particularly for coursework and research that doesn’t require heavy custom programming.
How long does it actually take to learn SPSS basics?
Most students can handle basic descriptive statistics and simple tests within a few hours of guided practice, though real comfort with the more advanced tests tends to build over a full semester of actually using it.
What’s the difference between SPSS and R for students?
R requires actual coding and gives you more flexibility for advanced or custom analysis, while SPSS leans on a simpler menu-based interface that’s usually faster to pick up for standard coursework.
Can SPSS handle survey data?
Yes, SPSS is commonly used for survey analysis, especially for crosstabs and chi-square tests that look at relationships between categorical survey responses.
Final Thoughts
SPSS looks a lot scarier on day one than it actually turns out to be once you understand the basic flow, set your variables up correctly, and know which test actually answers your question. Most of the frustration students run into comes down to a shaky setup, not the statistics themselves being genuinely hard. Take it one dataset at a time, don’t skip the Variable View setup no matter how tempting it is to jump straight to results, and don’t be afraid to get real-time help when your specific assignment doesn’t match the generic examples you keep finding online. Once it clicks, it clicks fast, and suddenly you’re the person your group project is asking to run the analysis.