
How to Master Business Data Analytics: Expert Tips Most Students Don’t Know
Business data analytics professionals spend 40 – 50% of their weekly hours on tasks that yield no results.
The numbers tell an interesting story. While 80% of companies use data in their departments from R&D to customer support and product management, 86% of professionals don’t trust their data enough to make decisions. This gap affects about 54 million data analysts worldwide, leaving significant potential untapped.
Resources aren’t the problem. Analysts can choose from more than 130 live online data analytics courses from leading providers and 90+ bootcamp options that suit different skill levels. But even talented analysts sometimes make mistakes that limit their impact.
This piece shows you ways to overcome these challenges. You’ll learn advanced data analytics techniques, customer experience analytics methods, and predictive modeling strategies that many analysts miss. Business intelligence and data analytics can work together to improve your decision-making process and help you be proactive in today’s ever-changing business environment.
Let’s tuck into the expert tips that will make you stand out as an analyst.
Understand the Core of Business Data Analytics
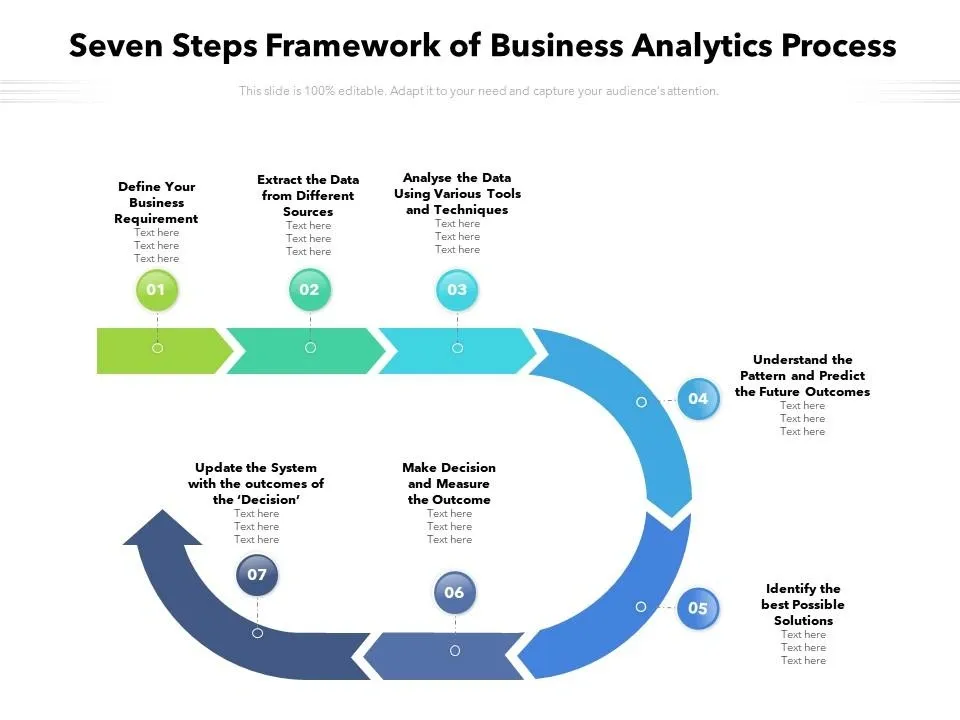
Image Source: SlideTeam
Business data analytics turns raw business data into practical insights using statistical methods and computing technologies. The practice applies specific techniques to learn from business data and make better decisions.
What is business data analytics?
Business data analytics collects, transforms, and organizes data to draw conclusions and guide informed decisions. The discipline has several views: a movement that promotes evidence-based problem-solving, organizational skills, data analysis and interpretation activities, a decision-making framework, and a set of practices and technologies.
The main goal is to learn about business problems through scientific asking, which helps organizations better understand user behavior and make data-driven decisions. Companies that use this method see better strategic planning results and happier customers.
Types of analytics: descriptive to prescriptive
Four main types of analytics build on each other to give increasingly valuable insights:
- Descriptive analytics answers “what happened?” by summarizing historical data to show patterns. It gives insight into past performance through data aggregation and mining.
- Diagnostic analytics answers “why did it happen?” by finding root causes of outcomes. It helps identify why certain events occurred through deeper data investigation.
- Predictive analytics forecasts “what will happen next?” by analyzing past trends to estimate future outcomes. Statistical models and machine learning determine likely scenarios.
- Prescriptive analytics recommends “what should happen?” by suggesting specific actions to achieve desired outcomes. This advanced analytics form provides recommendations for optimal next steps.
How analytics supports business intelligence
Business intelligence (BI) looks at past events, while business analytics focuses on why things happened and what might happen next. Business analytics is actually considered a subset of business intelligence. Analytics provides the analysis while BI handles the broader infrastructure for data identification and storage.
These two create a powerful combination. BI tools make analytics easier to understand by showing data in visual formats. This partnership helps organizations move beyond reporting past events to actively predicting and shaping future outcomes.
8 Expert Tips Most Analysts Don’t Know
Beyond the basics of business data analytics, expert techniques set masters apart from beginners. These advanced strategies will improve your analytical results:
1. Always define the business question first
You should clarify the exact business problem before working with any data. This approach stops you from wasting effort on unnecessary analysis and your findings will address what stakeholders need. Success metrics defined at this stage help maintain focus during analysis.
2. Use predictive modeling only when patterns are stable
Predictive models work best with stable, consistent data patterns. You should check pattern stability before using predictive analytics. Scenario planning gives better results than pure prediction in volatile markets or fast-changing conditions.
3. Don’t ignore outliers; they may reveal new trends
Take time to break down outliers instead of removing them right away. These data points often signal emerging trends or potential issues that standard analysis might miss. The outliers can also show flaws in your data collection process.
4. Confirm your KPIs with stakeholders regularly
Meet with business stakeholders every quarter to review key performance indicators. This practice keeps your analytics in line with changing business priorities and prevents wasted resources on metrics that no longer add value.
5. Automate data cleansing to reduce human error
Set up automated data cleansing pipelines to standardize your preparation process. This saves time and reduces inconsistencies that happen with manual processing. It also creates optimized analysis workflows.
6. Use customer experience analytics to learn about hidden insights
Look at customer touchpoints in different channels to spot friction points that traditional metrics miss. Combining numbers with customer feedback creates a better picture of customer behavior.
7. Avoid overfitting by testing on unseen data
Keep some data aside for validation testing. This helps ensure your models work well with new information instead of just memorizing existing patterns.
8. Visualize for clarity, not just esthetics
Create visualizations that show the main insight immediately rather than just looking impressive. Your graphics should answer the business question without needing much explanation.
Avoiding Common Pitfalls in Data Analysis
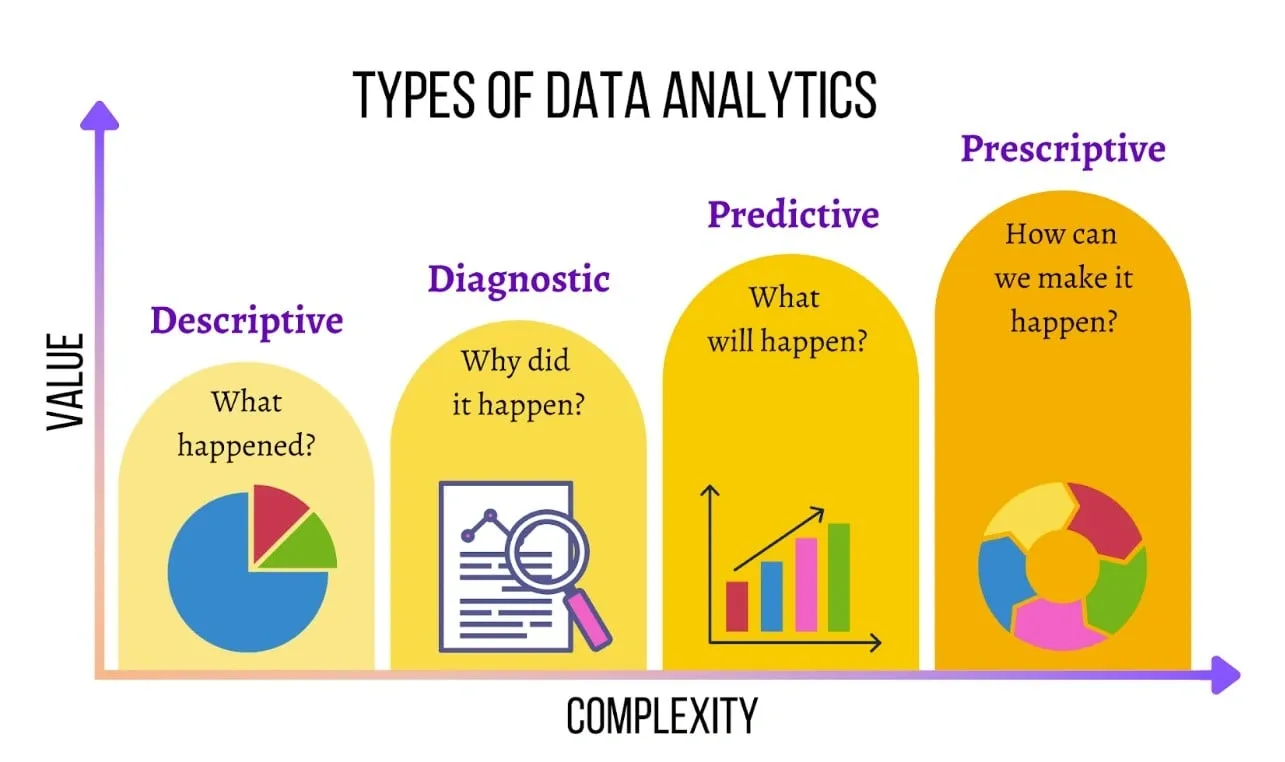
Image Source: DashThis
Data quality suffers when analysts, even experienced ones, fall into common traps. Your business data analytics practice needs to avoid these pitfalls to maintain analytical integrity.
Misinterpreting correlation as causation
Analytics faces a persistent challenge when people confuse correlation with causation. Two variables might move together, but this doesn’t mean one causes the other. Our minds naturally look for explanations when events appear related. To name just one example, ice cream sales and skin cancer rates show correlation, but neither causes the other – sunny weather drives both up. Scientists need controlled experiments with randomized variables to prove causation.
Using biased or incomplete data
Data bias happens when information doesn’t accurately represent its target population. Your analysis suffers when data goes missing – it reduces statistical power, creates bias in estimates, and makes analysis more complex. Biased samples might lead to unintended discrimination against customers, which exposes businesses to legal risks. Historical data bias creates serious problems. Vehicle safety testing shows this clearly – female crash test dummies were left out, which made women 17% more likely to die in accidents. You can prevent these issues by gathering samples from different time periods and customer segments.
Choosing the wrong metrics for the problem
Businesses head in the wrong direction when they pick inappropriate metrics. The best metrics compare well, make sense easily, show up as ratios or rates, and point to clear actions. Stay away from “vanity metrics” like total registered users – they always go up but offer little applicable information. Each metric needs specific business ownership to stop one team’s failures from hiding in another team’s success. The right metrics help find perfect products or services for customers at the ideal time.
Best Practices for Long-Term Success
Successful business data analytics needs systematic approaches that go beyond individual analyzes. Here are proven strategies to excel in analytics for the long term:
Standardize your data processes
Strong standardization creates consistency throughout your data pipeline. Your first step should be to define clear data goals and requirements. A centralized tracking plan should document standards such as naming conventions, data types, and formatting rules. Automation tools help apply consistent rules as data flows in. This method cuts down errors and ensures standards work at scale.
Collaborate with business teams early
Data collaboration sets successful organizations apart in today’s competitive world. Teams perform better when different types of expertise come together, which leads to better communication and higher sales. A corporate culture that celebrates working together helps break down data silos through regular team communication. Ready to excel in business data analytics? Get personalized guidance on predictive modeling from industry experts.
Use business intelligence tools for quick insights
BI tools enable organizations to make smart decisions and adapt to market changes quickly. Success starts with clear objectives that match business goals. The right tools should be easy to use, integrate well, and grow with your needs. High-quality data comes from good governance practices, while detailed training promotes user adoption.
Conclusion
Business data analytics is a crucial skill that sets successful organizations apart from those who struggle to understand their information. This piece shows how advanced analytical techniques can turn raw data into practical insights for better decision-making. Your mastery of these skills helps bridge the confidence gap that affects 86% of professionals using data.
The progression from descriptive to prescriptive analytics adds increasing value to your organization. You can now go beyond understanding past events to diagnose causes, predict outcomes, and determine the best courses of action. This complete approach makes you substantially more valuable as an analyst.
Few analysts fully implement the eight expert tips outlined earlier. Better analyzes come from defining business questions first, handling outliers appropriately, proving KPIs right regularly, and avoiding predictive modeling pitfalls. Data cleansing automation and thoughtful visualization design save countless hours and deliver clearer insights.
Watchfulness against common analytical traps is key to maintaining data integrity. Correlation versus causation errors, biased data samples, and misaligned metrics can undermine sound analytical work. Standardized data processes, early collaboration with business teams, and appropriate business intelligence tools are the foundations for lasting success.
Keep in mind that effective business data analytics needs more than technical expertise – it demands business acumen, communication skills, and strategic thinking. These advanced techniques will help you find insights others miss and deliver results that positively affect business outcomes. Your organization will then move beyond data collection to control its power for competitive advantage.